Business Cycle Sector Timing
The business cycle is a pattern that captures changes in economic activity over time. The changes in the business cycle occur in a sequential or serial manner, moving through a predictable sequence of phases. These cycles are consistent but vary in both duration and intensity. The phases of the business cycle are:
- Expansion: This is the phase where the economy is growing. During an expansion, economic growth is positive, leading to increased production, job creation, and rising prosperity
- Peak: The peak is the highest point in the business cycle, where the economy is operating at or near its full potential. Economic indicators may start to show signs of slowing growth, but it’s still a time of relative prosperity.
- Contraction (Recession): After the peak, the economy starts to slow down. This phase is known as a contraction or recession. Economic growth becomes negative or significantly slows, leading to reduced consumer spending, lower business investments, job losses, and declining production. This is generally a period of economic hardship.
- Trough: The trough is the lowest point in the business cycle, where the economy hits bottom. Economic indicators may show very weak performance during this phase.
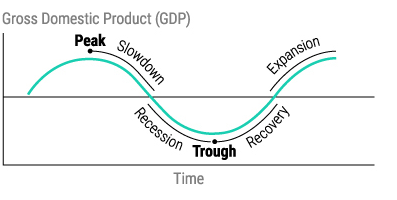
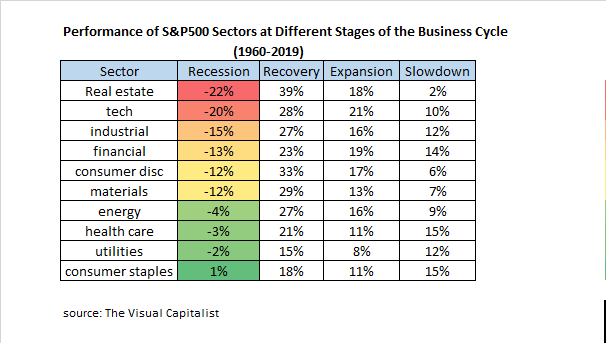
Notice that the Peak and Trough are followed by a Slowdown and Recovery. This part is important because peaks and troughs (tops and bottoms) are only known after the fact. Most of the time in the business cycle is spent in the four phases of Recession, Recovery, Expansion and Slowdown. It is logical to assume that different sectors of the economy will perform better in these four phases since they have different degrees of economic sensitivity. The original post in The Visual Capitalist was an amazing summary of S&P500 sector performance during these periods of the business cycle going all the way back to 1960. The data is summarized below:
Clear and predictable patterns begin to emerge and it is even more helpful to summarize the sector performance using normalized z-scores showing the deviation from average sector performance on a scale from 0 to 100% during each phase:
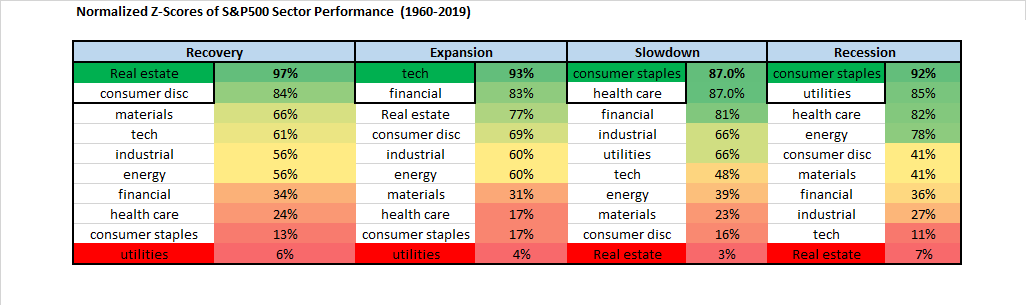
Recessions and slowdowns favor holding consumer staples which makes sense because they are products that people buy regardless of the state of the economy such as food and cleaning products. Recoveries (and also expansions) favor real estate likely due to the fact that it has more debt and hence leverage (and therefore earnings operating leverage) to a rebound in economic activity. As economic activity rebounds vacancies begin to shrink, demand causes rents to climb and the price of land and buildings also tend to rise. During expansions the fastest growing companies are naturally going to be technology companies because they are the easiest business models to scale quickly and gain millions of consumers with the least amount of capital invested.
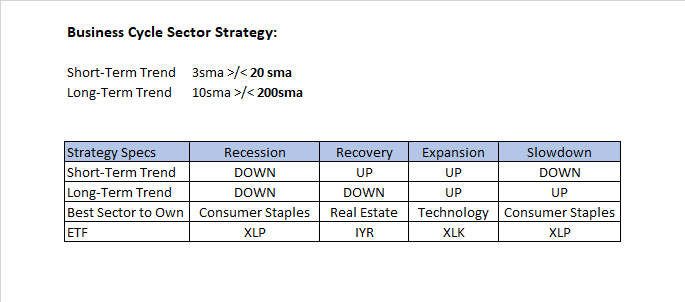
But how do we capture this in a quantitative strategy? Notice that timing the business cycle with four phases looks a lot like a trend-following strategy since we are following changes in GDP. One of the best ways to capture market expectations for changes in GDP in real time without using lagging data is to simply look at the S&P500 index. An expansion is naturally a period when both short and long-term trends are going up. A slowdown is when the long-term is up but the short-term is rolling over. A recession is when the long-term and short-term are down. A recovery is when the long-term is down but the short-term is up. This simple definition avoids having to define the four phases in economic terms but most importantly because it is impossible to predict when these phases will happen until after the fact. Every single phase of the business cycle MUST occur following changes in the trend of the market. While false signals are to be expected, this approach will be able to profit from changes that occur the few times that the signals are correct. Here is a simple strategy to capture this below:
Here is the performance of this strategy over the last 23 years. It would be interesting to see how this performs going further back using either daily or monthy data.
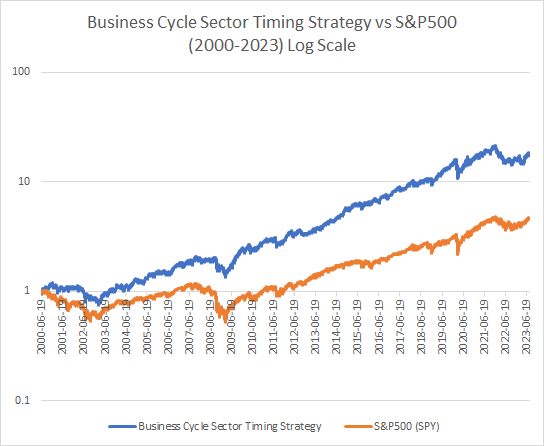
Here are the impressive summary stats of this strategy which is 100% always in the market holding equities:
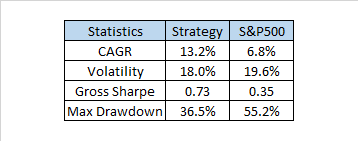
The performance of this business cycle sector timing strategy substantially outperforms the S&P500 with lower volatility. Perhaps with tactical overlays the risk-adjusted performance can be further enhanced. Having tested a lot of momentum strategies on sectors with disappointing returns the explanation is likely that they capture a lot of noise and fail to capture economic logic. There are a lot of possible ways to improve this business cycle strategy and also ways to make it more robust. Next week when I return from vacation I will try to post a follow up showing different ways to implement this strategy and also present some additional ideas. In the meantime I will not be responding to comments.


Great piece David – nice to see you back writing. Two comments for whenever you’re back:
– I’m not sure I understand your trend notation of 3sma >/ 20sma = short term uptrend?
– Looking at your fund selection list, do you think choosing XLK is too much hindsight bias in terms of the dominance of tech since 2000?
Thanks for sharing!
Thanks Damian good to hear from you. The signals involve comparing the 3-day moving average to the 20-day to generate the short-term trend and the 10-day moving average versus the 200-day to generate the long-term trend. Since 1960 there has been tech sector dominance in expansion according to the research so that was interesting. Still all of this contains hindsight bias because we know what performed well in each regime. I think that long-term data and theory/logic supports this model which is why I like it. David
Welcome back David. We have missed you!
Sent using myEarthLink
Thank you Jerry nice to hear from you. David
Nice work David; glad to see you back at it.
Thanks Scott, good to hear from you.
David