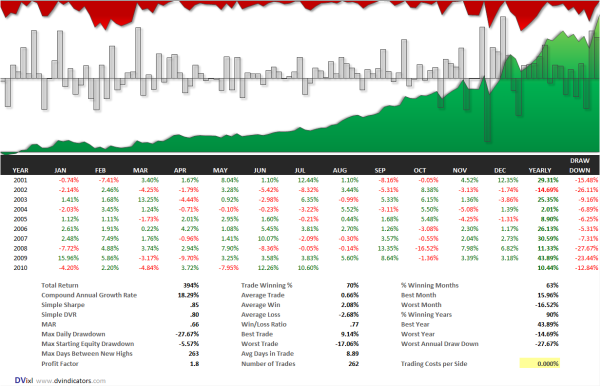
DVI and SPY Performance
Michael at MarketSci has been reviewing some statistics on the DVI: http://marketsci.wordpress.com/2010/07/29/exploring-the-dvi-indicator-extreme-readings/ . The tests that MarketSci has covered are long only going back to 1970. Michael has done an excellent job showing overall how the DVI works. To provide some added information, the DVI considers two factors in determining overbought (>.5) or oversold (<.5) readings: 1) the magnitude of the returns over an intermediate interval and 2) the stretch in terms of the ratio of up to down days over an intermediate interval. Some smoothing is built in intentionally to make the indicator an “axis of value” rather than a peak/valley indicator–such as conventional momentum oscillators (RSI2, DV2, Stochastics etc). This is reflected in the analysis by MarketSci in the recent post. The smoothed DVI takes longer to move from oversold to overbought and vice versa. This makes it a great complement to moving average strategies like the golden cross. Below is a backtest of going long/short the DVI at the median .5 levels. We used our upcoming tool DVixl to generate the backtest. DVixl is an excel-based platform that is extremely practical and easy to use. It will be available very soon with details to follow. Note that the DVI has absolutely crushed the S&P500 in the last few months.


Hi David,
I don’t know if you’re aware but I created a Tradestation indicator based on the excel file that Micheal posted. I assumed that since you released the calculations you wouldn’t mind.
Oh, forgot to mention where… on the DvIndicator forums.
thanks a lot josh, much appreciated. that isn’t a problem.
best
dv
Hi David,
I got quite interested in the fact that you made the code public via Michael’s blog (thank you!) as it seems to have performed quite well on your and Michael’s studies. I recall reading that you use the DVI to help you determine whether you stay in a position or not..
I was quite keen on implementing it on my backtesting platform and test it as an addition to a Trend Following system (basically to improve the exit criteria by adding a “reversal” indicator, which would signal weaknesses before the traditional TF exits which are usually more subject to whipsaws).
However, there does not seem to be any sort of indicator length setting (which I would have thought need to vary depending on which timeframe you’re looking at). Did you test different lengths yourself and if so, which lookbacks did you alter (there are quite a few different ones in the indicator calculation)?
hi jez i think that the dvi would function reasonably on commodities but not quite as well as one would expect since it is binary and not a turning point indicator. for commodities some of the better overbought/oversold indicators function on a 20-60 day time frame based on my own testing. i would be happy to discuss this with you further via email.
best
dv
Hey David, I following here the MS’ excel version of the DVI and by my replication it looks that the results YTD are poorer then your table–which makes me believe I have gone somewhere off but I do not know where. It looks like the indicator produced badly divergent performance by April and then followed the SPY to a big drawdown for the year by May. Do you assume that you go into the new trade at the close of the signal day or at the open of the next?
hi kostas, it looks like you did it incorrectly for sure. our results are definitely correct. we assume trading at the close of the same day based on the signal at the close.
best
dv
Hey David, I have do not doubt I am off and have huge respect for your work–I just think I followed faithfully the MS spreadsheet and I am trying to figure out where things got off. Just to test it, if you have the time: It looks like in my variant YTD two trades undermined the strategy creating an early divergent underperformance: going Short 2/17-3/26 for -5.7% and going again Short 4/5-4/22 for -1.9% both in an otherwise uptrending market. (Later the strategy seems to have gone Long 4/27-6/3 for -6.6% in an otherwise declining market, but this was in sync with the market). Are these legitimate trades based on your method?
hi kostas when we have a chance we will take a look and get back to you.
best
dv