Percentile Channels: A New Twist On a Trend-Following Favorite
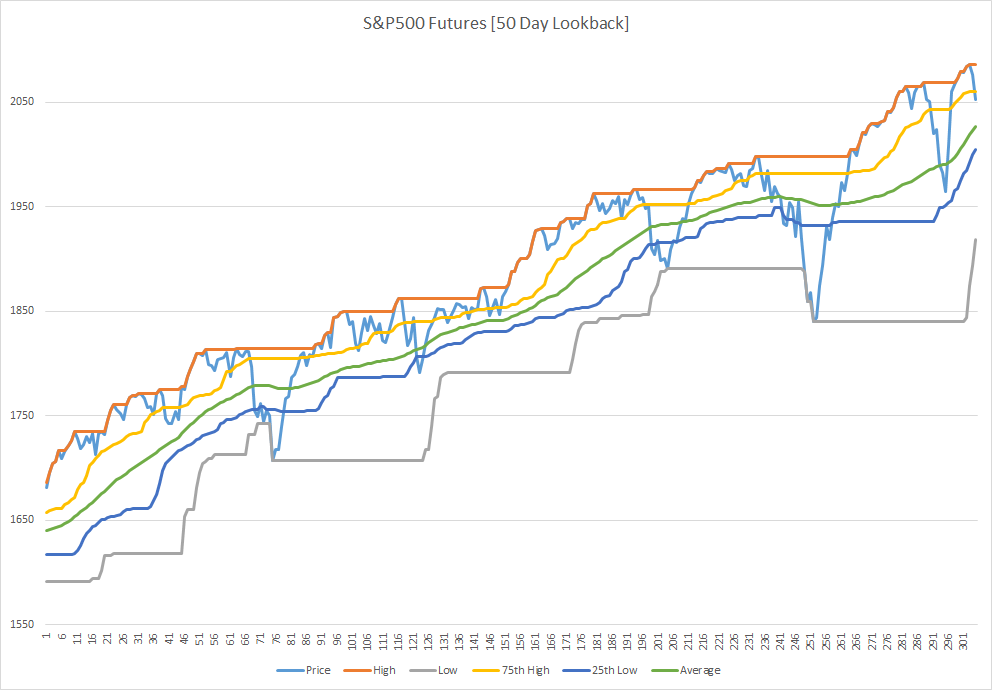
One of the most widely used trend-following approaches are Donchian Channels which were popularized by the famous “Turtle Traders.” In fact, it was the subject of Donchian Channels that started my collaboration with Corey Rittenhouse with the popular post Percent Exposure Donchian Channel Method. One of the original turtle systems used a 55-day donchian channel that bought at new 55-day highs and sold at new 55-day lows. This system- along with many other popular systems- suffered an erosion in profitability as other people copied the same approach. What has often fascinated me is how one might go about front-running such systems to achieve superior profitability. While I was thinking about this concept, I theorized that entering prior to new highs or lows might create an early entry that would be sufficient to avoid false breakouts induced by system traders. As an alternative one could use Percentile Channels- which function the same as Donchian Channels but instead use the percentile of the price specified instead of a maximum or minimum. Below is a picture comparing percentile channels to donchian channels:
For a fun experiment I decided to run a test using the Commodity Index (DBC- extended with index data) as a rough proxy for a trend-follower’s portfolio with Donchian Channels versus Percentile Channels. The original 55-day Donchian Channel is used to trade long or short on new highs/lows, versus a 55-day Percentile Channel with a 75th and 25th percentile threshold.
The results from 1995-2014 are presented below:

Interestingly enough, the percentile channels help to revive a broken system with earlier entries. Another turtle system–perhaps the most famous- used the 20-day Donchian Channel. For added robustness, lets see how percentile channels might revive this long-broken system:

While this isn’t a perfect proxy for a futures/trend-following portfolio, the results show that it is possible to revive old systems based on new highs and lows using a less restrictive percentile channel approach. This leads to earlier entries that avoid the noise generated from competing signals. Regardless, percentile channels are just another tool for trend-following and can create a wider range of support/resistance type systems by varying the chosen entry/exit threshold.


Hey David, long time no speak. Glad to see the blog active again. To clarify, in your tests, are you initiating trades when price breaches then 75th/25th channels, and then closing when price moves back within the 75th/25th bands?
hi Ben, hope you are well–good to hear from you. A long position would be initiated if the price exceeds the 75th percentile of prices over the last “n” days. The position would be closed if the price falls below the 25th percentile of prices over the last “n” days.
best
david
Dear David,
are you using close only values or high/low as well? Is this also a SAR model (stop and reverse = always in the market)?
hi Ricardo, hope you are well. this is just using close only values– it is SAR, once you go long above the upper threshold you stay long until you go below the lower threshold where you would go short (and vice versa). The same applies to a traditional channel approach.
best
david
what are the labels for each number of your results?
8.91% is that annualized… per trade?
.39?
-40% max drawdown?
hi buddy, that is the annual return to the strategy, .39 is the sharpe ratio, -40% is max dd
best
david
Original Turtle rule was buy b/o of 55-day channel. Sell on break/down of the 20-day (not the 55-day as you have back tested here). It is not a SAR system. The second system (using 20-day for both buy/sell is as you have implemented here).
Pyramiding was also a critical aspect of the system.
how are the weights computed?
how are the weights calculated?
I’m still dont undertand how the percentile channel is calculated, could some help visitor with its formula please? Thanks a lot.