Adaptive VIX Moving Average
One of the challenges with technical or quantitative analysis is to identify strategies that can adapt to different market regimes. The most obvious is a change in the forecast or implied volatility as proxied by the VIX. During more volatile periods we would expect more signal noise and during less volatile periods we would expect less signal noise. But how do we capture this in a strategy? One method is to use the VIX to standardize returns as presented on this blog used “VIX-Adjusted Momentum” in this post. An excellent recent follow-up analysis was done by Justin Czyszczewski which showed that VIX-adjusted trend-following has been recently very successful during these fast moving markets (Tip: using the median or average of O,H,L,C of VIX versus closing data will make the edge of the original strategy more consistent across history). I will show a new variation using this framework very soon in a follow-up post.
Another way to tackle this issue is to vary the lookback length as a function of the VIX. So how would we do that? Enter the basic adaptive moving average framework which seeks to vary the speed or lookback of the moving average as a function of some volatility or trend-strength function.

We can easily substitute the VIX within the “VI” by looking at a standardized measure of how high or low volatility has been relative to past history. If it is higher we want to smooth more or have a longer lookback, and if it is lower we want to have a shorter lookback. This can be accomplished as follows:

Basically we are taking the percentile ranking using all history to date of 1 divided by the current average VIX over the past 10-days. To visualize how this moving average works we can see it applied to the S&P500 (SPY) in the chart below:

Notice that the moving average tracks the price very closely during bull markets and then filters out noise by becoming smoother during corrections. This is exactly what we want to see! Now lets compare a standard 200-day sma strategy that uses the current price versus using the Adaptive VIX Moving Average filter.
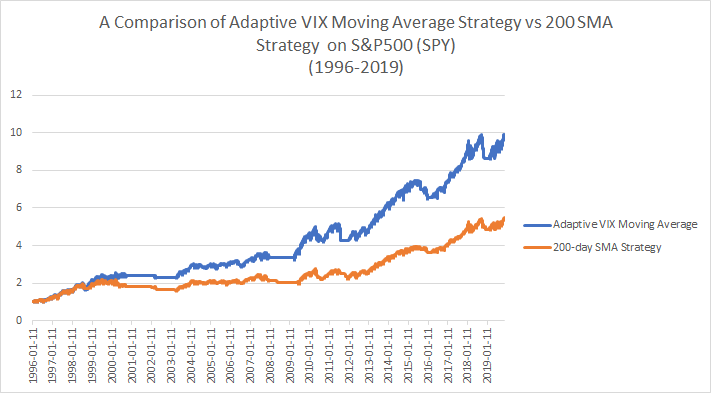
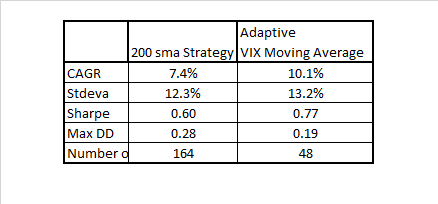
The result is a nice boost in gross performance (no transaction costs) that also happens to come with far fewer trades (48 vs 164) which would even further boost net performance. The results are in the table below:
This concept can be extended in several ways including using a simple moving average on the AMA line to create faster crossover strategies that are more responsive to market conditions. Ultimately this is a very simple and intuitive way to adjust standard trend-following as a function of changing volatility regimes.


Brilliant concept and your usual impeccable quantitative analysis. Would love to implement. Anyone have the Thinkscript (TOS study code) for this? Thanks David…
Thank you- much appreciated! If you do find or create code I am happy to share on the blog.
best regards,
David
Hi David, great post. I remember reading the original idea back in 2014! I have attempted to replicate in excel using data from Bloomberg, but your steps have confused me. I’ve tried a couple of alternative interpretations to no effect when trying to replicate the Adaptive VIX MA chart overlaid on SPY. Could you please help me with the steps? I have tried both the percentrank of SPX and VIX (based on OHLC) but that doesnt get me to an index adjusted level that could be charted vs normal 200sma, and I’m also confused by you omission of the SN and FN variables? If you could shed some light on the steps to replicate the chart that would be greatly appreciated. Thanks, James
Hi James, thank you. You are taking the percentrank of 1/average VIX (10-day avg of O,H,L,C) across all history available at the time. This value is slotted into the “VI” in the AMA formula provided. Not sure where you are referring to “SN” and “FN” variables– I refer to “SC” (slow-constant) and “FC” (fast-constant) which are stated as .075 and .75 on the blog. The chart is of SPY not SPX- hope that helps
best regards,
David
Thanks David. I have got as far as the following. 1) 10-day avg OHLC VIX = 12.71 . 2) PERCENTRANK = 0.17 [back to 1992]. 3) ‘a’ = ((0.17*(0.75-0.075)+0.075)^2) = 0.035 . 4) I am getting confusing results at the point that I then multiply ‘a’*SPX[close] = 109.9… It is too erratic and will not be anywhere near the spot price / 200day MA? If you could help with this last bit I would be very grateful. I think this is clearly a more useful indicator that the SMA. If you are on Bloomberg, I can always IB you. Thanks, James
hi James, you need to use 1/VIX which is why you get a low percentrank instead of a high percentrank which is what you should have. Also you need to use SPY and instead of multiplying by the close you are taking the final result and using it as the alpha parameter for an exponential moving average of the SPY.
best regards,
David
Hi David, thanks for your previous comments. I now have; 1) 10-day avg VIX = 12.71, 2) 1/VIX = 0.079, 3) ‘VI’ = 0.083, 4) ‘a’ = 0.41 (=(0.83*((0.75-0.075)+0.075))^2)), 5) SPY = 290.25… the AMA formula refers to the AMA 1 period ago? Is that what the other reader was referring to by ‘recursive’? I’m not the best at maths but would like to replicate the moving average so I can do some further testing of my own, and consider implementing it in my risk management toolbox. Any last clarification that will help me to get there would be very kind. Thanks, James
Hi James, I will try to provide a spreadsheet for readers so you can see how it is calculated.
best regards,
David
Hi David, did you ever make the sheet available? Still keen to compare vs my replication. Thanks
Hi David,
thanks so much for this analysis!
I’m getting a little confused as to how the signal is generated… I assume the “close” in the AMA formula (AMA(1) + a * (close – AMA(1)) ) would be the close of the SPY?
Would you then go long if SPY>AMA?
Thanks a lot!
hi Eva, yes it would be the close of the SPY but you are going long when AMA> SMA(SPY) in this case the SMA is 200-days. Alternatively you could use SMA of the AMA as well (AMA> SMA of AMA).
best regards,
David
Thanks David, now it makes sense… Great job, beautiful way of filtering!
thanks Eva, it is very commonly used in the AMA framework.
best regards, David
Hello David. Interesting average. How do you initialize the recursive formula? Thanks.
I’m facing the same thing! I just don’t get it, following the calculation of ‘a’ (after ‘VI’). ‘a’ is 0.41 on my sheet. SPY was 290.25. Are we supposed to take a 200 day SMA and then multiply it by this factor? Still not right. Maybe David can help clarify. Thanks
hi Michael, hope you are well and thank you. You can initialize using a simple moving average (just like in an EMA framework). It is advisable to start the initializing at least after you have gathered data on the VIX (which is used to calculated the alpha in the EMA using the equations on the blog). Hope that helps.
best regards,
David
Thanks David. What did you use for the initialization (assuming you can talk about it.)? I have VIX data since 1990 so that is not problem since SPY starts in 1993. tried a few different methods but the AMA appears sensitive to initial conditions and I couldn’t match your example.
hi Michael, I used a 10-day sma of SPY approximately 6200 bars back in time. The VIX used the 10-day average of O,H,L,C of VIX and the distribution was calculated approximately 6500 bars back in time. I don’t see much sensitivity to starting point– are you sure you are using the anchored percentage ranking to all history available at each point in time?
best regards,
David
Hi David. Is the SMA200 system you are comparing to as follows?
Buy if close > SMA(200)
Exit if close < SMA(200)
I get only 80 trades for long-only. Other parameters are about the same since 01/1996. For the VIX AMA strat I get only 23 trades, so in both cases about half of what you report.
Michael, I think you are counting round trips, I consider a new buy or a sell as a trade.
best regards,
david
I see then you are counting signals, not closed trades. That explains it. It’s matter of definition. Thanks. The VIX AMA results in the table I assume are for the strat VIX AMA > SMA(200) for buy and VIX AMA < SMA(200) for sell. I may write something about this in my blog because the idea of an adaptive MA with VIX is interesting.
hi Michael, yes that is correct- and thank you would be interested to see your analysis as always.
best regards,
David
Hi David, Thanks for the interesting post! 200 day SMA tends to be prone to reversals/whipsaws so people sometimes use other variants that are less prone like 21day SMA vs 200day SMA – any idea how something like this last variant would compare to the adapative vix variant in the post? thanks again.
Hi David
Have you tried out different underlyings with less bullish trends than the SPY ? I am curious to see the results of the filtering, would it lower the amount of drawdowns (ie wrong signals) ?
I reproduced most of this post in Python: https://youtu.be/Voc78gnKX7s