When Should You Buy Momentum? Mean-Reversion in The Momentum Factor
Recently there was a good post by Bespoke Research highlighting the “Momentum Massacre” that we recently witnessed in the market. High- flying momentum stocks were decimated and the low momentum/losing stocks made a roaring comeback. One of the best ways to track the momentum factor is to look at the ETF ticker symbol: MOM or QuantShares U.S. Market Neutral Momentum Fund. As you can see in the chart below, the momentum factor has taken the elevator down over the past 10-days completely reversing total returns year to date.

This begs the obvious question: can we expect some mean-reversion in performance going forward? As a simple test I took a look at 10-day returns in MOM and smoothed them using a 5-day average to account for some of the noise in closing prices for less liquid ETFs. Then I took the cumulative percentile ranking looking at all data available at each point-in-time of that smoothed 10-day return. What I found was that in the last 8 years (the maximum data available), the momentum factor has been highly mean-reverting. If you bought the momentum factor after smoothed 10-day returns were above the median (.5) you lost money consistently. In contrast if you bought when returns were below the median you made money consistently. Clearly mean-reversion has been a powerful factor driving performance as you can see in the chart below:

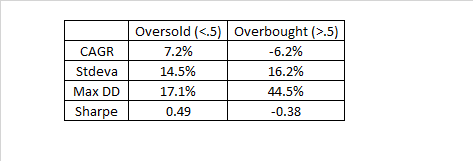
To get a sense of how this would benefit investors that follow high momentum stocks, I looked at how using the same mean-reversion oscillator on MOM could be used to time MTUM or iShares MSCI USA Momentum Factor. In the chart below we see that using this oscillator has been a very useful way to time whether to be in or out of high momentum stocks:

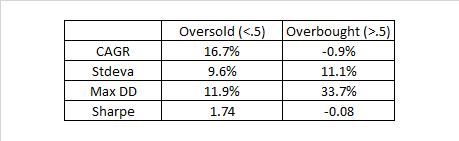
When the momentum factor was oversold (<.5) you made almost 17% annualized with a sharpe of 1.74, and in contrast when the momentum factor was overbought- which was nearly 50% of the time- you lost money. One of the obvious questions is whether there is some bias in the momentum methodology unique to MTUM that makes it less generalizable to a more concentrated approach. To address this concern I tested using the oscillator on QMOM or Alpha Architect’s U.S. Quantitative Momentum ETF. While there is a much shorter history the general conclusion is the same: mean-reversion in the momentum factor is a good way to time momentum stocks:

Finally, and perhaps the most interesting test was whether or not the momentum factor on stocks can be used to time asset class momentum. I have read studies in the past that show that the momentum factor is correlated to asset class momentum. If that is the case then we can expect that the oscillator should be effective in timing global asset allocation. To test this I used GMOM or Cambria’s Global Momentum ETF. The chart tells the story below:

Clearly mean-reversion has been effective for timing global asset allocation that uses a momentum approach. What was surprising was just how effective it was. Having more data using proxy strategies to test these hypotheses over a larger sample size would be valuable, but I currently don’t have access to that data on a daily basis going far back in time. Nevertheless, it is still very important to respect current market trends and how they impact investment strategies. In recent times, the effect of mean-reversion in momentum factor is a very real and material driver of performance.
Why might there be a mean-reversion effect in the momentum factor? I think that a lot of stat arb money chases the momentum factor, and to be able to rebalance in order to maintain risk limits and to unwind positions they need to sell when they are profitable and buy back when they are losing money. To do so requires that a lot of retail and other institutional money be chasing or fleeing from momentum in order to provide them with liquidity. Perhaps this “smart money” effect explains why momentum is mean-reverting. In either case trying to explain why this happens would require a very thoughtful and deep analysis in the form of a serious research paper.


Hi David, great post. If I understand correctly, you simply used MOM ETF as your data input, and then smoothed it before calculating the percentile rank (to determine the median). You mentioned something about ‘less liquid ETFs’ though which made me question whether my understanding is wrong?
Could you possibly provide a link to your spreadsheet or methodology in order to replicate the MOM ‘reversion signal’?
Thanks
Thanks James, I used the smoothing of the returns because the closing prices of less liquid etfs can sometimes be noisy due to small and uneven lot trades made at the open. However using the Fama/French momentum factor in place of MOM shows the same effect. I can’t commit to providing a spreadsheet, but the description and indicator is very simple.
best regards,
David
This is so interesting and looks very easily tradable. Thanks for sharing. I wonder if you can see a similar effect in other factors like value (CHEP), BAB (BTAL), or size (SIZ)? Or is this an uniquely momentum phenomenon?
Thanks Danny, I will have to test it- I believe that BTAL shows the same effect. It is worth testing for a future post so great suggestion.
best regards,
David
Using Mean-Reversion in the Percentile Channels strategy, it will work?
Diego you can use the OB/OS Oscillator on Investor IQ for the ticker MOM (under Factor Market Neutral) if you want to track mean-reversion in momentum.
BUY momentum factor if 10 day return were below the SMA (5) of 10 day return
SELL momentum factor if 10 day return were above the SMA (5) of 10 day return
It is correct?
Thanks!!!
Hi James, it is buy if the percentrank of the 5sma of the 10-day return is less than .5.
best regards,
David
Thanks. Always use the MOM signal, or you can do it with the same asset that you are going to trade (ex. MTUM, QMOM, GMOM)
Today MOM OB/OS Oscillator is 38, but MTUM OB/OS Oscillator is 65. What signal should I take to trade MTUM? BUY OR SELL? Thanks
Thanks. Always use the MOM signal, or you can do it with the same asset that you are going to trade (ex. MTUM, QMOM, GMOM)?